
Sports energize our bodies and brighten our social lives, yet every game, climb, or leap carries some risk. Asking “Which sport is most dangerous?” sounds simple, but the answer changes with the yard-stick you use: total injuries, injuries per hour, or severity. Below, we explore seven activities—American football, basketball, rock climbing, ice hockey, rugby, BASE jumping, and gymnastics—using clear everyday language and the latest injury numbers. No jargon, no scare tactics—just facts and practical context.
American Football
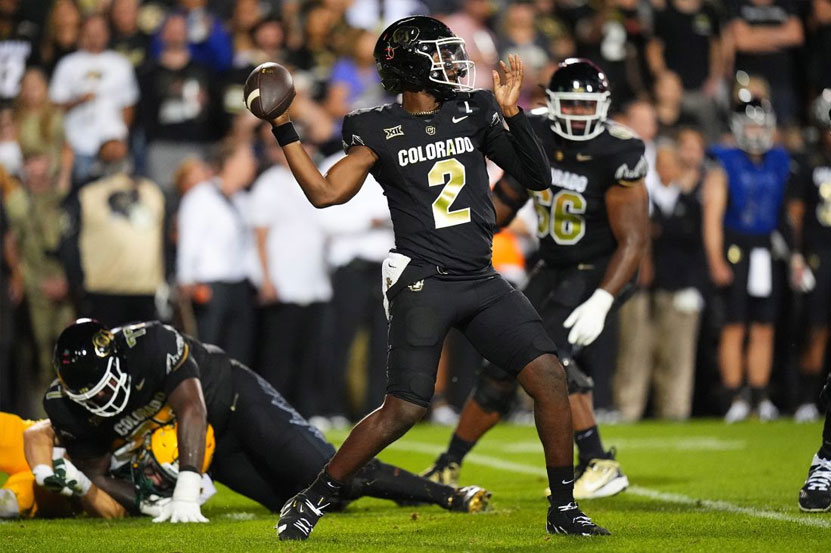
College data show about 36 injuries for every 1,000 player-appearances in games, the highest rate of any major U.S. team sport. In high-school play the figure falls to roughly 4 per 1,000, but football still tops the chart there as well.
- What gets hurt? Knees, ankles, shoulders and, crucially, brains—concussions form roughly 7 % of all recorded injuries.
- Why so many? Heavy collisions on every snap, brief rest between plays, and bodies that keep getting bigger and faster.
- Risk tamers: Better tackling form, limits on full-contact practices, and strict concussion protocols.
Basketball
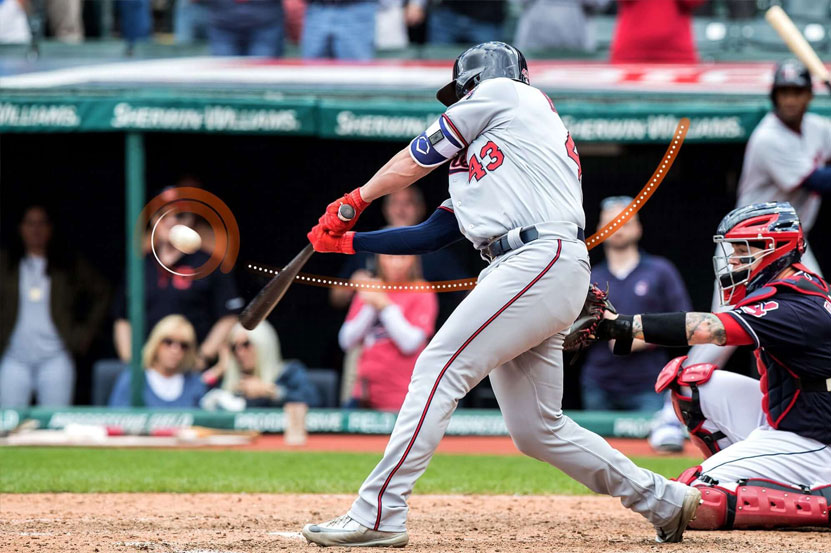
NCAA surveillance reports about 7 injuries per 1,000 player-appearances overall, with games twice as risky as practices. NBA research places the rate near 19 per 1,000.
- Common injuries: Ankle sprains lead the way, followed by knee strains and finger jams.
- Key triggers: Sudden direction changes, fatigue in late quarters, slick floors, and poor shoe support.
- Safer play: Targeted ankle and hip strength work, routine court cleaning, and enough recovery sleep.
Rock Climbing

Large surveys peg climbing at about 4.2 injuries per 1,000 hours—with most of those being slow-building overuse aches. When only sudden accidents are counted, the rate plunges to 0.2 per 1,000 hours. Older work on traditional outdoor climbing showed rates as high as 37 injuries per 1,000 hours.
- Injury mix: Finger pulley tears, elbow tendinitis, shoulder strains; big falls can break ankles or backs but are rare.
- Why? Tiny holds, repetitive grip positions, and in outdoor settings, longer, riskier falls.
- Smart moves: Gradual grade progression, finger-taping know-how, and learning proper fall technique.
Ice Hockey

Overall college rate: ~5–6 injuries per 1,000 player-appearances; game action can spike beyond 16 per 1,000.
- Hotspots: Hip/thigh strains, shoulder separations, and head or facial injuries; about 12 % of all recorded cases are concussions.
- High-risk moments: Open-ice checks at full speed and battles along the boards.
- Safety gains: Visor mandates, tougher penalties for head shots, and reduced hitting in practices.
Rugby
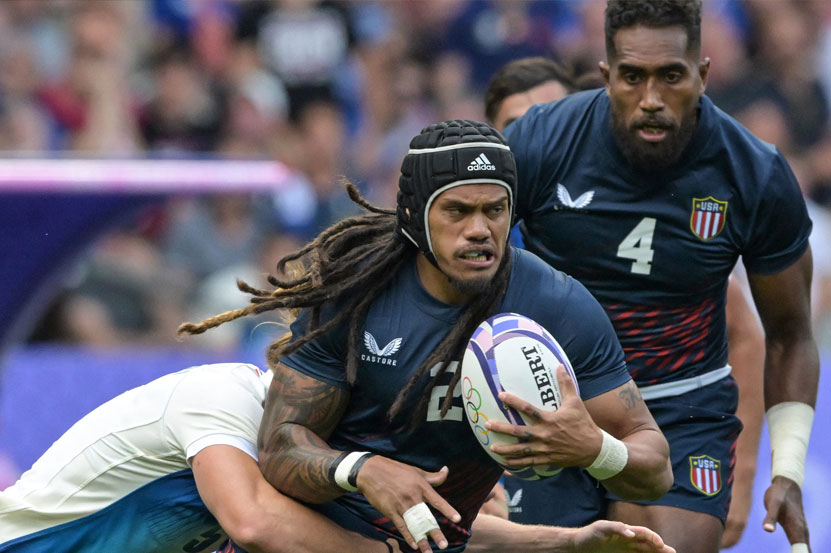
Senior amateur rugby sees ~47 injuries per 1,000 match-hours; elite play can soar past 80 per 1,000.
- Typical damage: Lower-limb muscle tears, shoulder dislocations, facial cuts, and concussion rates on par with football.
- Tackle trouble: The defender (tackler) faces the greatest danger.
- Ongoing fixes: Lower legal tackle heights, mandatory sideline head checks, and caps on weekly contact sessions.
BASE Jumping
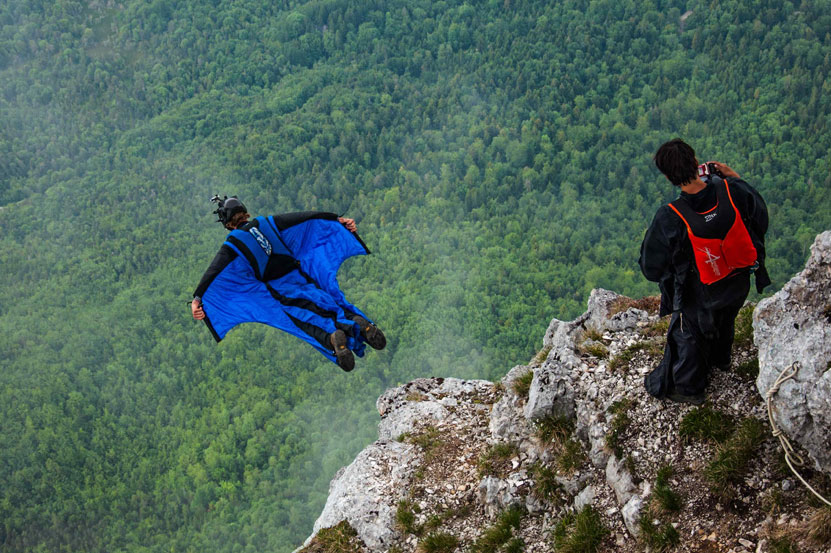
A niche sport with small participation but outsized danger: ~0.2 % severe-injury rate per jump and ~0.4 deaths per 1,000 jumps.
- Injury pattern: Broken legs, pelvic fractures, and spinal trauma from hard or off-course landings.
- Risk drivers: Low altitude leaves little time to correct parachute malfunctions or adverse winds.
- Mitigation: Strict weather limits, modern wingsuits, and meticulous exit briefings—yet the activity remains far riskier than mainstream sports.
Gymnastics
NCAA women’s gymnastics logs ~9 injuries per 1,000 appearances, with competitions roughly twice as risky as practice. One elite youth study found over 90 % of athletes hurt at least once each season.
- Frequent injuries: Ankle sprains, wrist pain, ACL tears, plus back stress fractures from repetitive hyper-extension.
- Why? Landings that load joints with multiple times bodyweight and high skill repetition at young ages.
- Safer routines: Thicker mats, limited hard-surface dismounts, balanced strength training, and sensible event quotas.
Conclusion
Measured by sheer count, American football remains the injury leader in organized North-American sport. Rugby and ice hockey trail closely when judged per hour of match play. Consider gravity-sports severity and BASE jumping leaps to the front—fewer incidents, but a vastly higher chance of death or life-altering trauma each time. Rock climbing appears gentler overall, though it can punish fingers and shoulders. Gymnastics and basketball occupy a crowded middle, riddled with ankle, knee, and overuse woes.
No matter the ranking, smart preparation—sound technique, progressive workloads, good gear, and honest rest—slashes risk in every activity. Play hard, train wisely, and keep the thrill alive without unnecessary pain.
FAQ
Which sport here is the least risky?
Indoor rock climbing; accidental trauma hovers near 0.2 per 1,000 hours when overuse injuries are set aside.
Do youngsters get hurt as often as adults?
Rates are lower, but football and gymnastics still lead youth injuries. High-school football logs about 4 injuries per 1,000 player-appearances.
What’s an “athlete exposure”?
One athlete joining one practice or game—simple as that.
Does more padding always equal fewer injuries?
Padding softens blows but can invite riskier behavior. Helmets help, yet head injuries still happen when players hit harder under the shield of protection.
Practical steps to cut injury odds?
Warm up properly, build joint-supporting strength, refresh technique often, rest when tired, and replace worn-out equipment.
Why do studies disagree on numbers?
Researchers count in different ways—per hour, per game, per exposure—and use varied injury definitions. Always check how the stat was calculated.
Should a high injury rate stop me from playing a sport I love?
Not automatically. Physical activity brings huge health and social rewards. Learn the risks, train smart, and enjoy the game on your terms.
Leave a Reply